Introduction to PySpark Pivot
PySpark pivot is a PySpark pivot that is used to transpose the data from a column into multiple columns. In addition, it transposes from row to column.
The PySpark pivot is used for the rotation of data from one Data Frame column into multiple columns. It is an aggregation function that is used for the rotation of data from one column to multiple columns in PySpark. This improves the performance of data and, conventionally, is a cheaper approach for data analysis. Post Pivot, we can also use the unpivot function to bring the data frame back from where the analysis started.
In this article, we will try to analyze the various method used for a pivot in PySpark.
Let us try to see about Pivot in some more detail.
Syntax of PySpark Pivot
The syntax for the Pivot function is:-
>>> c= b.groupBy("Name").pivot("Add").count().show()
>>> c.show()
b:- The data frame used for conversion of the columns.
groupBy:- The groupBy needed for the grouping of columns.
pivot:- The Pivot function to be used with the column name.
C:- The new PySpark Data Frame.
Screenshot:-
Working of PySpark Pivot
The pivot operation is used for transposing the rows into columns. The transform involves the rotation of data from one column into multiple columns in a PySpark Data Frame. This is an aggregation operation that groups up values and binds them together.
The pivot method returns a Grouped data object, so we cannot use the show() method without using an aggregate function post the pivot is made. The aggregate function such as sum count can be used and check the pivot value.
Post PySpark 2.0, the performance pivot has been improved as the pivot operation was a costlier operation that needs the group of data and the addition of a new column in the PySpark Data frame.
It takes up the column value and pivots the value based on the grouping of data in a new data frame that can be further used for data analysis. The operation involves the conversion of data in columns in multiple columns that involves further the aggregate function to be used for making the operation costly, and sometimes memory exceptions can also happen.
The unpivot operation is a reverse pivot operation that is used to reassign the values back to the data frame. It rotates back the columns again to row values.
Let’s check the creation and working of the PIVOT method with some coding examples.
Examples of PySpark Pivot
Let us see some examples of how the Pivot operation works:-
Let’s start by creating simple data in PySpark.
>>> data1  = [{'Name':'Jhon','ID':21.528,'Add':'USA'},{'Name':'Joe','ID':3.69,'Add':'USA'},{'Name':'Tina','ID':2.48,'Add':'IND'},{'Name':'Jhon','ID':22.22, 'Add':'USA'},{'Name':'Joe','ID':5.33,'Add':'INA'}] A sample data is created with Name, ID and ADD as the field.
>>> a = sc.parallelize(data1)
RDD is created using sc.parallelize.
>>> b = spark.createDataFrame(a)
Created Data Frame using Spark.createDataFrame.
Screenshot:-
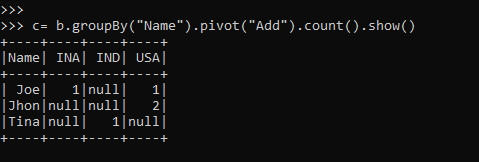
Let us try to use the pivot of this PySpark Data frame.
>>> c= b.groupBy("Name").pivot("Add").count().show()For pivoting the data columns, we need to aggregate the function based on a column value. The return type of this will be a grouped data that can be further used back with the count operation to be displayed as the resulting output.
So the pivot will change the row-column of the data frame and group the data based on the Name column in the PySpark data frame.
Output:-
The grouping element and the pivot element can be the same, and the data can be pivoted based on the same column.
Let us check this with some examples.
>>> c= b.groupBy("Name").pivot("Name").count().show()It groups data based on column value, and then the pivot operation is implemented over the column in the PySpark Data frame.
Output:-
We can also use the sum as the aggregate function and can pivot the data accordingly.
Let’s try summing up the ID and then pivoting the data with it.
>>> c= b.groupBy("Add").pivot("Name").sum("ID").show()This sums the ID and assigns the value in the new column based on the ADD; the one not satisfying the condition is assigned as null.
Screenshot:-
Note
- Pivot is a data frame transpose operation.
- Pivot is used for the rotation of data from one Data Frame column into multiple columns.
- Pivot groups the rows and then converts the elements into multiple columns.
- Pivot is a row to column transformation.
- Pivot is a costlier operation as it transforms the row data into a column.


